

Your email delivery rate is the share of sent messages that the receiving mail servers accepted: emails sent minus bounces, divided by emails sent. A healthy, permission-based list should now land around 97% or higher, because current benchmarks put average bounce rates at roughly 1% to 2.5%. Being accepted is not the same as reaching the inbox, though. Validity’s 2026 benchmark report puts the global average inbox placement rate for 2025 at 87.2%. The biggest change since this post was first written is that Gmail and Yahoo began enforcing their bulk sender rules in February 2024, and Microsoft followed in May 2025. Those rules cover SPF, DKIM, DMARC, one-click unsubscribe and spam complaint rates, so authentication and complaint rates now affect delivery as much as list hygiene does.
Why “delivery rate” causes so much confusion
Marketers “should understand that a lot of confusion exists around what the term delivery rate means, and be careful in making comparisons. Secondly, they should work with a provider that can provide insights in to these different aspects of delivery. And, finally, they should dig into their data and identify whether any delivery problems that they have are driven by list hygiene or by ISP blocking and filtering. By digging down to the root causes, marketers can take corrective action and improve any delivery issues that they have- whatever way you define it!” (Ken Takahashi, Email Insider)
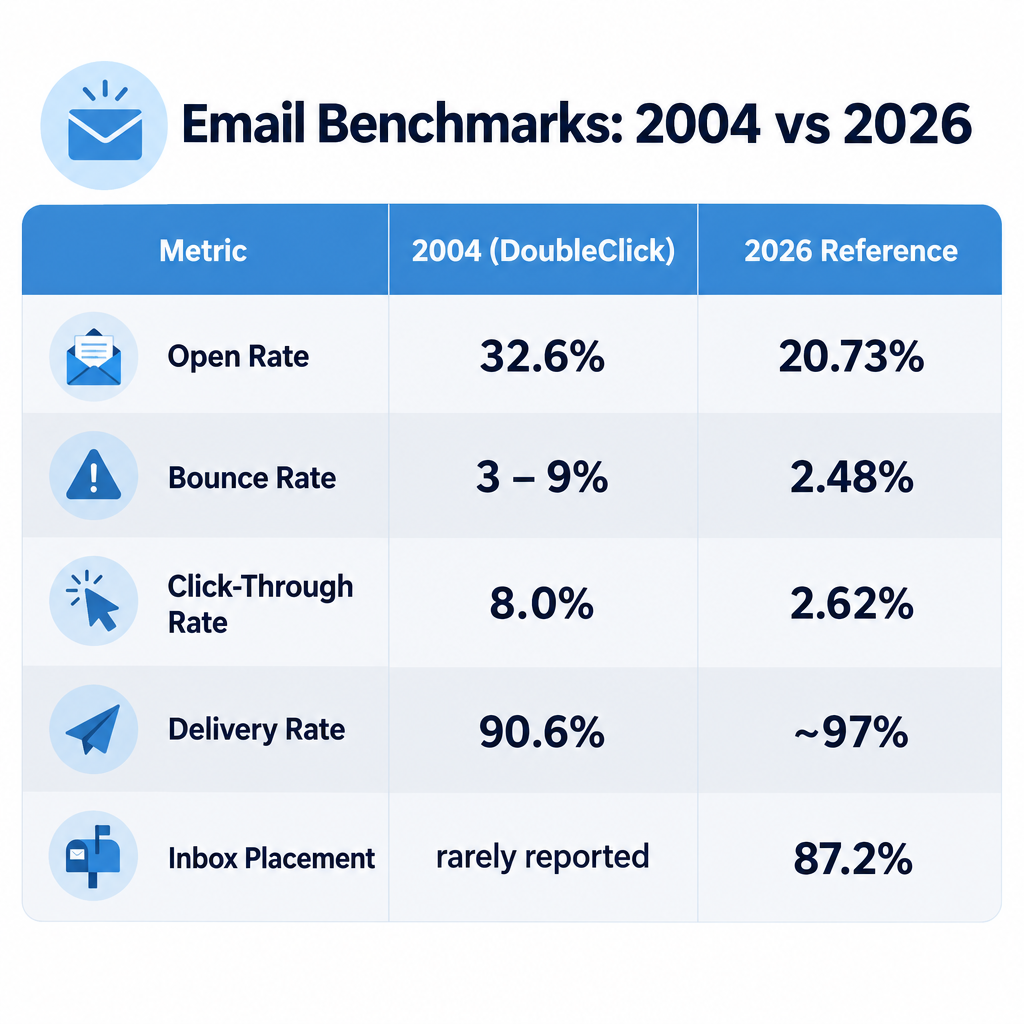
The confusion is real, and it has grown since that column ran. One vendor’s “delivery rate” is another vendor’s “acceptance rate”, and some dashboards quietly blend in inbox placement. The standard definitions below separate the four numbers marketers mix up most often. Each one comes with what it meant in the mid-2000s and what it means today.
| Metric | What it measures | 2004 figure (DoubleClick, Q4 2004) | Current reference point |
|---|---|---|---|
| Open rate | Unique opens divided by delivered emails | 32.6% average | 20.73% average, or 33.87% counting Apple MPP opens (Brevo 2026) |
| Bounce rate | Rejected emails divided by sent emails | 3% to 9% quoted for double opt-in | About 2.48% across industries (WebFX 2026); aim for under 2% |
| Click-through rate | Clicks divided by delivered emails | 8.0% average | 2.62% across Mailchimp users; 1.69% for Klaviyo campaigns |
| Delivery rate | Sent minus bounces, divided by sent | 90.6% average | Roughly 97% or more on a clean list |
| Inbox placement | Share of delivered mail that reached the inbox, not spam | Rarely reported then | 87.2% global average for 2025 (Validity 2026) |
The 2004 numbers are history. DoubleClick, which Google acquired in 2008, reported them before smartphones, Gmail’s tabs, image proxies and privacy features changed how email is read and measured.
Standard email metric definitions
The four definitions below follow the original order. Each one opens with a plain definition, then explains why the old benchmark no longer works and what to measure in its place.
Open rate
Open rate is the number of unique opens divided by the number of delivered emails. It is now the least reliable metric in email marketing. Use it for trends inside your own account, not for comparisons across the industry.
The original version of this post tied open rates to spam filters, and part of that still holds. Legitimate mail does sometimes get flagged as spam (a false positive), and a message sitting in the spam folder counts as “delivered” but almost never gets opened. So low inbox placement drags down open rates even when your delivery rate looks fine.
Two later changes matter much more:
- Image proxies. Opens are tracked by a tiny image. Since 2013, Gmail has loaded images through its own proxy servers and cached them, which hides the reader’s location and device and can blur repeat-open data.
- Apple Mail Privacy Protection (MPP). Since iOS 15 in September 2021, Apple Mail can preload tracking pixels for users who turn the feature on, and each preload registers as an “open” whether or not a person read the email. Brevo’s 2026 benchmark shows the size of the effect: a 20.73% average open rate without MPP opens and 33.87% with them.
The old line that “an open rate of 50% to 60% is considered a highly successful campaign” should be retired. A 50% open rate today often just means many of your subscribers use Apple Mail. Most ESPs, including Mailchimp and Klaviyo, now let you filter out or flag machine opens. Do that before you set open-rate goals, and judge success on clicks and conversions.
Mobile and dark mode reading also affect results. Many emails are now first seen on a phone, often with dark mode on. A design that breaks there will get fewer clicks, even though it does not change the open count.
Bounce rate and invalid addresses
Bounce rate is the share of sent emails that the receiving server rejected. A hard bounce is a permanent failure, such as an address that doesn’t exist. A soft bounce is temporary, such as a full mailbox or a server rate-limiting you.
The old benchmark of a 3% to 9% bounce rate for double opt-in lists is far too generous today. Across industries, WebFX’s 2026 figures put the average bounce rate at 2.48%, and most deliverability guidance treats anything above 2% as a warning sign. Double opt-in lists should come in well under that, because every address was confirmed when it signed up.
Bounces now have a second cause that list hygiene can’t fix: authentication failures. Since November 2025, Gmail has rejected non-compliant bulk mail more actively. Temporary rejections come back with 4.7.x codes and permanent ones with 5.7.x codes. If your bounce logs show authentication-related 5.7.x codes, the fix lies in your DNS records, not your list.
To keep bounces down:
- Suppress hard bounces right away and never mail them again.
- Retry soft bounces, then suppress any address that keeps soft bouncing over several sends.
- Remove or re-permission contacts who haven’t engaged in a long time, before the addresses go dead.
- Never buy or rent lists. Purchased lists are full of dead addresses and spam traps.
Click-through rate
Click-through rate is unique clicks divided by delivered emails. It depends heavily on content and on how relevant the email is to the reader. It is now the most dependable engagement number you have, because privacy features inflate opens but not clicks.
DoubleClick’s 8.0% average for Q4 2004, and the claim that a strong email could reach 15% to 25%, come from an era with far less email competing for attention. Current reference points are much lower. Mailchimp’s benchmarks page lists a 2.62% click rate across all users, and Klaviyo’s 2026 data puts a good campaign click rate at 1.69% and a good automated flow click rate at 5.58%. Flows score higher because they are triggered by something the subscriber just did.
Some tools also report click-to-open rate (clicks divided by opens). Since MPP inflates the number of opens, it shrinks this ratio, so compare it only across periods with a similar mix of Apple Mail readers.
Delivery rate
Delivery rate is emails sent minus bounces, divided by emails sent. In Q4 2004, DoubleClick called 90.6% an “all-time high”. Today that number would point to a serious list or authentication problem.
A worked example: you send 50,000 emails and 600 bounce. Your delivery rate is (50,000 − 600) ÷ 50,000 = 98.8%. If an inbox placement test then shows 10% of the delivered mail going to spam, only about 44,460 messages actually reached an inbox.
That gap is why the quote at the top still matters. A high delivery rate only tells you that servers accepted the mail. Inbox placement tells you whether people could see it. Validity’s 2026 report put the global average inbox placement rate for 2025 at 87.2%, up from 83.5% the year before. Validity credits the gain partly to the new mailbox provider requirements. Reporting on the same data puts Microsoft’s consumer mailboxes clearly behind Gmail and Yahoo.
What mailbox providers require from bulk senders today
Gmail, Yahoo and Microsoft now publish clear rules for high-volume senders, and breaking them hurts both delivery and inbox placement. The core requirements line up closely:
| Requirement | Gmail (enforced from February 2024) | Yahoo (enforced from February 2024) | Outlook.com (enforced from May 5, 2025) |
|---|---|---|---|
| Who counts as a bulk sender | About 5,000+ messages a day to personal Gmail accounts | No fixed volume published; 5,000 a day is a common rule of thumb | 5,000+ messages a day to hotmail.com, live.com and outlook.com |
| SPF and DKIM | Both required | Both required | Both must pass |
| DMARC | Published record, at least p=none, aligned with the From domain | Published record aligned with the From domain | At least p=none, aligned with SPF or DKIM |
| One-click unsubscribe | Required for marketing mail | Required for marketing mail, honored within 2 days | Recommended |
| Spam complaint rate | Under 0.3%, ideally under 0.1% | Under 0.3% | Not published as a fixed limit |
| Non-compliant mail | Temporary and permanent rejections since November 2025 | Filtering or blocking | Routed to Junk |
A minimum DMARC record that meets all three providers’ floor looks like this:
_dmarc.example.com. TXT "v=DMARC1; p=none; rua=mailto:[email protected]"
The one-click unsubscribe method in RFC 8058 uses two headers: a List-Unsubscribe header that contains an HTTPS unsubscribe URI, plus List-Unsubscribe-Post:
List-Unsubscribe: <https://example.com/unsubscribe?id=abc123>, <mailto:[email protected]>
List-Unsubscribe-Post: List-Unsubscribe=One-Click
Start with p=none so you can read the aggregate reports. Once every legitimate sending source passes, move to p=quarantine and then p=reject.
FAQ
What is a good email delivery rate?
On a permission-based list, aim for 97% or higher, which means a bounce rate under about 2%. Double opt-in lists that are cleaned regularly often do better. If you’re below 95%, look for old or purchased addresses, or for authentication failures in your bounce codes.
What is the difference between delivery rate and deliverability?
Delivery rate counts the emails the receiving server accepted. Deliverability, usually measured as inbox placement, counts the emails that reached the inbox instead of the spam folder. You can have a 99% delivery rate and still lose a large share of your mail to spam folders.
Why are my open rates so much higher than they used to be?
The most likely cause is Apple Mail Privacy Protection. Since 2021 it has preloaded tracking pixels for users who opt in, and each preload counts as an open. Brevo’s 2026 benchmark shows MPP lifting the average open rate from 20.73% to 33.87%, so filter out machine opens and judge campaigns on clicks.
How do I calculate email delivery rate?
Subtract total bounces (hard and soft) from emails sent, then divide by emails sent. For example, 20,000 sent with 300 bounces gives (20,000 − 300) ÷ 20,000 = 98.5%. Some ESPs leave soft bounces out, so check your platform’s definition before you compare its numbers with anyone else’s.
Does a high spam complaint rate hurt delivery rate?
Yes, and more directly than it used to. Google and Yahoo both set a 0.3% ceiling for bulk senders, and Google recommends staying under 0.1%. Senders above the line can see mail filtered to spam or rejected outright. Postmaster tools show your complaint rate, and Yahoo calculates it against mail delivered to the inbox, so your own figure may look lower than theirs.
Do CAN-SPAM rules affect delivery rate?
Not directly, but the habits CAN-SPAM requires (an honest sender, a working unsubscribe link and opt-outs honored within 10 business days) are the same habits that keep complaints and bounces low. Penalties are steep: after the FTC’s January 2025 inflation adjustment, they can exceed $53,000 per violating email.
The most useful next step is to pull your last 90 days of sends and put four numbers side by side: delivery rate, bounce codes, spam complaint rate and clicks. Delivery rate shows whether servers accepted your mail. The other three show whether people saw it and wanted it.
Sources
- Google: Email sender guidelines
- Google: Email sender guidelines FAQ
- Yahoo Sender Hub: Best practices
- Yahoo Sender Hub: FAQs
- Microsoft Tech Community: Outlook’s new requirements for high-volume senders
- FTC: CAN-SPAM Act compliance guide for business
- Federal Register: FTC adjustments to civil penalty amounts (2025)
- Validity: 2026 Email Deliverability Benchmark Report
- Mailchimp: Email marketing benchmarks
- Klaviyo: Email marketing benchmarks
- Brevo: Email marketing benchmarks