
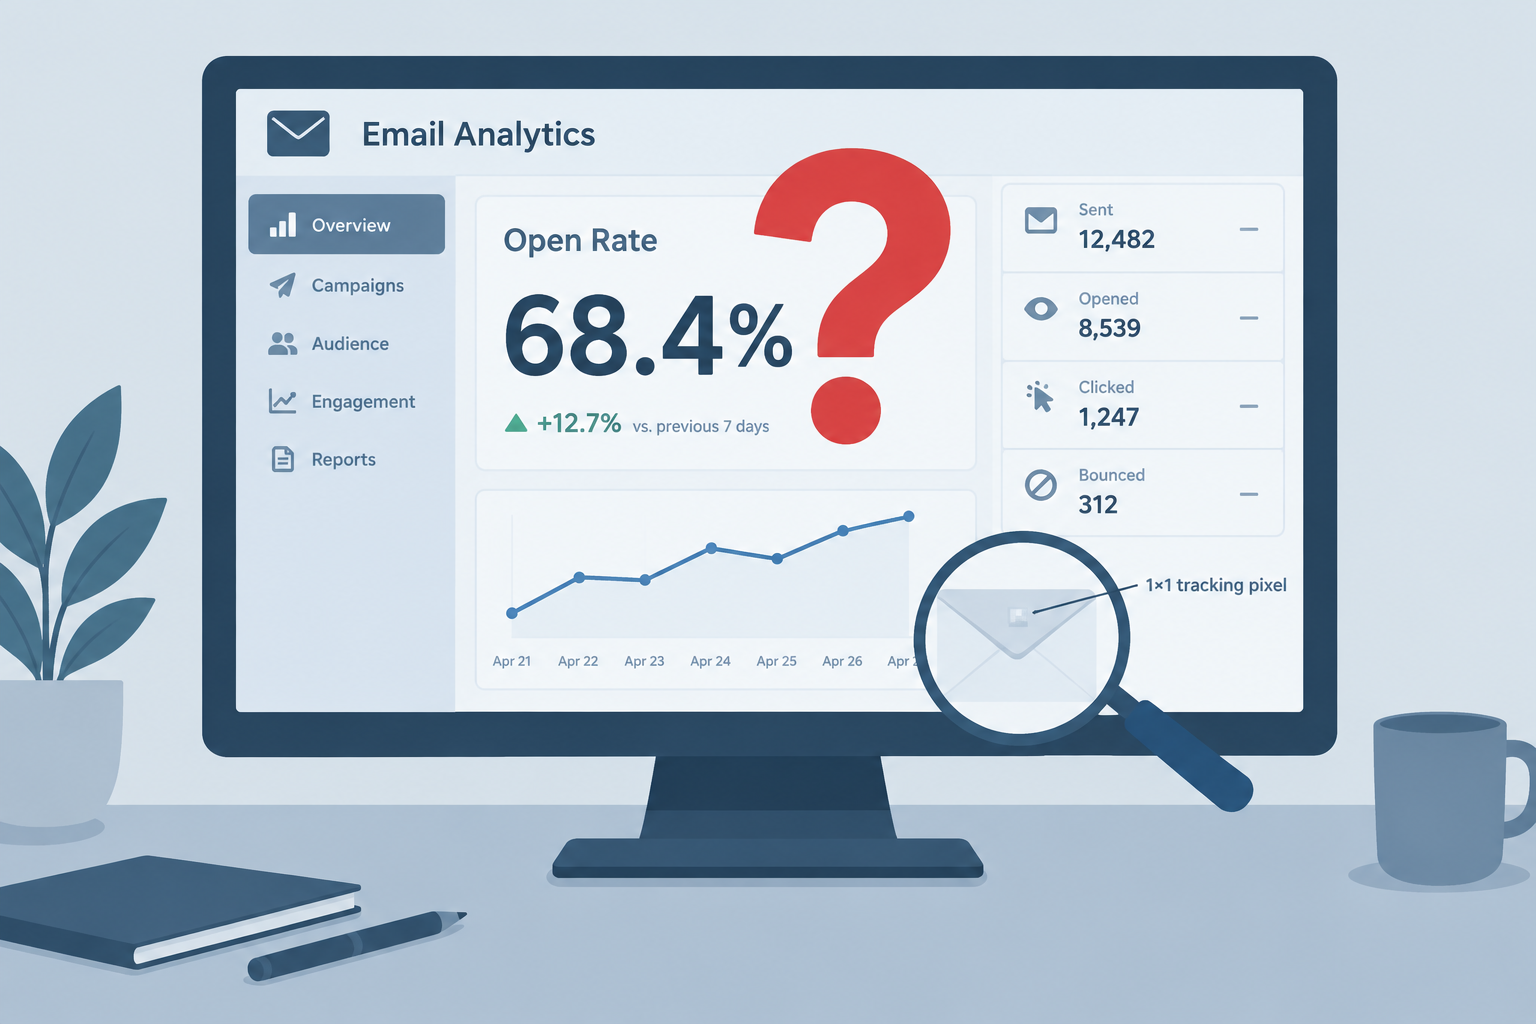
According to the MarketingSherpa 2007 Email Marketing Benchmark Guide, analysts and email experts were moving away from open rate as a measure of success. Instead they used it as a benchmark for judging subject lines.
That advice has held up for almost two decades. If anything, it matters more now than it did in 2007.
Why open rates stopped being a reliable success measure
An open is not a direct measurement. Your email service provider (ESP) puts a tiny, invisible tracking image in each message and records an “open” whenever that image is downloaded. Anything that downloads the image without a person reading the email inflates your count. Anything that stops the download hides real readers.
Preview panes, and now machine opens, record opens nobody made
Preview panes let an open register even if the recipient never really looks at the message. In the desktop clients of that era, a reader could tab past an email for a moment, the images would load, and an open was recorded. That open had nothing to do with how the recipient engaged with the message.
Today the same problem works at a much larger scale:
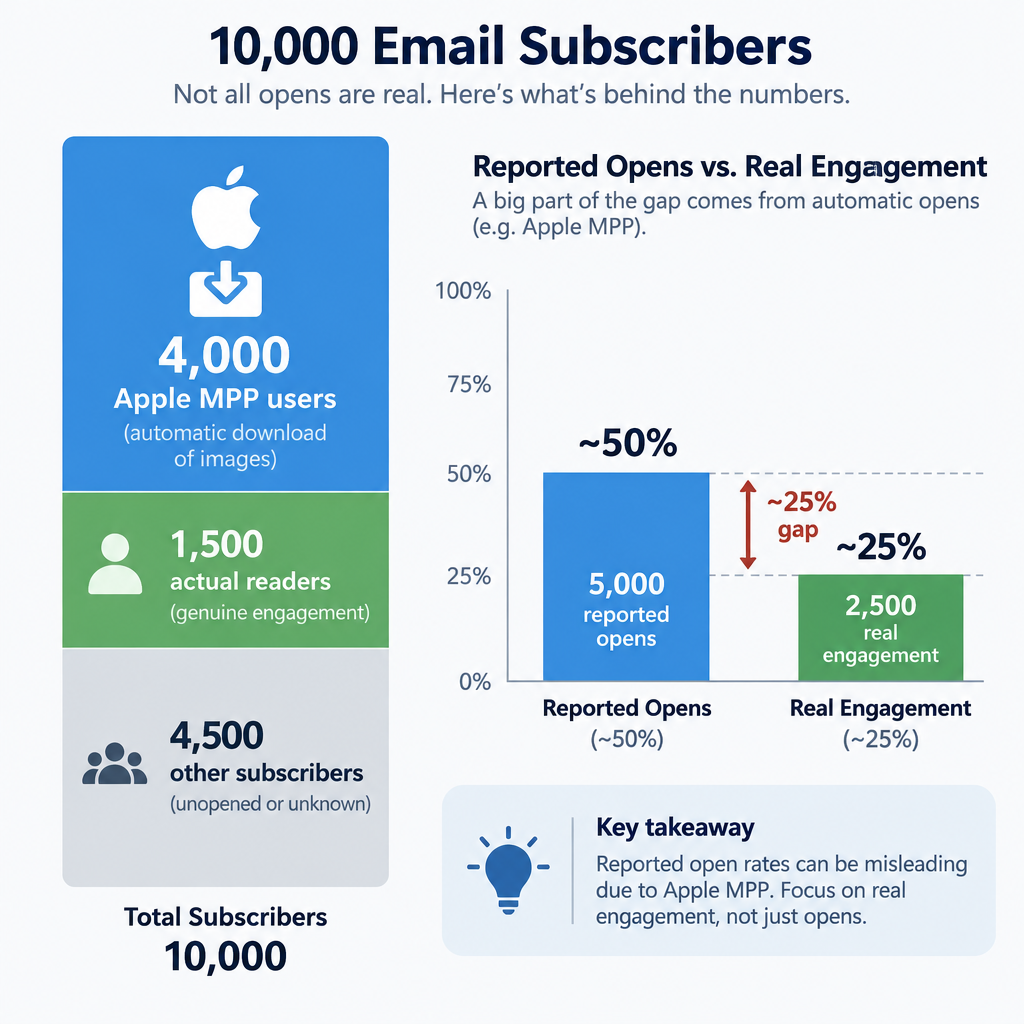
- Apple Mail Privacy Protection (MPP). This arrived with iOS 15 and macOS Monterey in 2021. When a user turns it on, Apple Mail downloads remote content in the background, whether or not the person opens the email. It also routes the request through a proxy that hides the reader’s IP address. Every protected message can show as “opened” when it lands, so Apple users with MPP enabled look close to 100% engaged.
- Gmail’s image proxy. Since December 2013, Gmail has shown images by default and fetched them through Google’s own servers. It caches images too, so you usually see the first open but not the repeat opens, and you see Google’s location instead of the reader’s.
- Security scanners. Corporate filters and link-checking services often fetch images and follow links to check them for threats. That creates opens, and sometimes clicks, within seconds of delivery.
Here is how that plays out on a list of 10,000. Say 4,000 subscribers read in Apple Mail with MPP on and 1,500 of them actually read your email. Your report still counts something close to 4,000 opens from that group. A campaign that 25% of people really opened can then show an open rate well above 50%. Nothing about the subject line changed. The pixel just fired automatically.
Blocked images can hide real readers
Blocked images skew the results in the other direction. In 2007, the new version of Hotmail (Windows Live Hotmail), AOL, Outlook 2003 and the Yahoo! Mail beta all blocked images by default. When images were blocked, the tiny transparent image that records an open never loaded, so people who read the email in text only were never counted.
That list is history now. Hotmail became Outlook.com, and Gmail and Yahoo Mail now show images by default for most mail. Blocked images still undercount opens in some places, though:
- Some desktop clients, including classic Outlook for Windows, can be set to block automatic picture downloads, and many company IT policies keep that setting on.
- Readers who turn off remote images in their privacy settings never trigger the pixel.
- Plain-text versions of your email have no pixel at all.
So the 2007 problem is still around, just smaller. On a typical consumer list today, machine opens inflate your count by far more than blocked images reduce it.
Filtering distorts what “delivered” means
Open rates are usually worked out from delivered messages, so filtering has always pulled them down. A message can show as delivered and still never reach the recipient’s inbox.
“Delivered” in your ESP report means the receiving server accepted the message. It does not mean the message reached the inbox. An email that goes to the spam folder, or to Gmail’s Promotions tab where nobody looks, still counts as delivered, and it drags your open rate down without telling you why.
Mailbox providers have also become much stricter about what they accept at all:
| Mailbox provider | Rules took effect | Who they apply to | Main requirements |
|---|---|---|---|
| Gmail | February 2024, with stronger enforcement from November 2025 | Senders of about 5,000+ messages a day to personal Gmail accounts | SPF, DKIM and DMARC; one-click unsubscribe; spam rate kept below 0.3% |
| Yahoo Mail | February 2024, with one-click unsubscribe enforced from June 2024 | Bulk senders (Yahoo does not publish a fixed volume threshold) | SPF, DKIM and DMARC; one-click unsubscribe on marketing mail; complaint rate below 0.3% |
| Outlook.com, Hotmail.com, Live.com | May 5, 2025 | Senders of 5,000+ messages a day | SPF and DKIM pass; DMARC of at least p=none, aligned with SPF or DKIM |
Since Gmail stepped up enforcement in November 2025, it can defer or reject non-compliant mail outright instead of just sending it to spam. Rejected mail shows up in your reports as bounces. Mail that is accepted but filtered still shows up as a low open rate. Google recommends keeping your spam rate below 0.1%, and you can check it in Google Postmaster Tools. That figure says far more about your inbox placement than your open rate does.
A minimal DMARC record that meets the Microsoft and Gmail baseline looks like this:
_dmarc.example.com. IN TXT "v=DMARC1; p=none; rua=mailto:[email protected]"
And the two headers that make one-click unsubscribe work (RFC 8058) look like this:
List-Unsubscribe: <https://example.com/unsubscribe?id=abc123>
List-Unsubscribe-Post: List-Unsubscribe=One-Click
Where open rate still earns its place
The open rate your ESP reports is not accurate, but it still has value as a week-to-week or month-to-month signal of interest in your emails. Back in 2007, MarketingSherpa reported that the number of marketers tracking open rates had dropped for the first time.
Today, open rate works best for a few narrow jobs:
- Subject line and sender name tests. Split a send in two at the same time, to the same audience. Machine opens should affect both halves about equally, so the gap between them still means something, even if the totals are inflated.
- Spotting deliverability trouble. A sudden drop at one mailbox provider, such as Gmail opens falling while Yahoo stays flat, often means you are landing in spam there.
- Rough engagement trends. Compare a campaign with your own history, not with an industry average, because each list has a different mix of Apple, Gmail and Outlook readers.
It is much worse for jobs it used to do. Re-engagement and sunset segments built on “has not opened in 90 days” now leave MPP users in the “engaged” group forever. Send-time optimisation and “resend to non-openers” campaigns suffer the same way. Many ESPs, Mailchimp and Klaviyo among them, now label likely machine opens or let you filter them out of reports and segments. Turn that on if your platform offers it.
The honest counter-argument is that a noisy metric is still better than none for small senders. If your list is too small for click data to be meaningful, opens are often the only signal you get from a single send. Keep watching them. Just treat them as a hint, not a verdict.
What to measure instead
The original post promised to answer this question later. The answer now is to rank your metrics by how close they are to what you actually want subscribers to do.
| Metric | What it tells you | How reliable it is today |
|---|---|---|
| Conversions and revenue per email | Whether the campaign did its job | Highest, if your tracking is set up properly |
| Click-through rate (clicks ÷ delivered) | Real interest in your content and offer | High, though security scanners can add bot clicks |
| Unsubscribe rate | Whether content and frequency still fit your list | High |
| Spam complaint rate | Your reputation with mailbox providers | High; check it in Google Postmaster Tools and the Yahoo complaint feedback loop |
| Bounce rate | List quality and authentication problems | High |
| Click-to-open rate | How well the content performed once opened | Low, because inflated opens push it down |
| Open rate | Subject line comparisons and trend alerts | Lowest |
For most programs, watch three numbers together: clicks to judge content, conversions to judge business value, and complaints to judge list health. If clicks and conversions are rising, a falling open rate is rarely worth worrying about. If clicks drop and complaints rise, a healthy-looking open rate will not save you.
FAQ
Is open rate still worth tracking in 2026?
Yes, but only for narrow uses. It is still useful for A/B testing subject lines within the same send and for spotting a sudden drop at one mailbox provider. It is not reliable as proof that a campaign succeeded, because Apple Mail Privacy Protection and Gmail’s image proxy record opens that nobody made.
How much does Apple Mail Privacy Protection inflate open rates?
It depends on how many of your subscribers read in Apple Mail with the feature turned on. MPP preloads the tracking pixel for every protected message, so those subscribers can look close to 100% opened. Lists with a large share of iPhone readers see the biggest inflation. Your ESP’s client report or its MPP filter shows how big that share is for you.
What is a good click-through rate?
Benchmarks vary widely by industry and by how each ESP calculates them, so your own history is a better guide than any published average. Track click-through rate against delivered messages, compare each campaign with your last ten or so, and look into any sharp drop. Unlike opens, clicks need a real action, although security scanners can still add some false clicks.
Do Gmail’s Primary and Promotions tabs affect my open rate?
Yes. Mail sorted into the Promotions tab is delivered and counted in your denominator, but people check that tab less often, so fewer of them open. That does not mean you are in spam. Watch your Gmail spam rate in Google Postmaster Tools to tell a tab problem from a deliverability problem.
Should I remove subscribers who never open?
Be careful with open-based cleanup. MPP users show opens they never made, and people who block images show no opens even when they read. Build sunset segments on clicks, purchases and site visits as well as opens, and send a re-engagement email before you remove anyone.
Does a low open rate mean I am in the spam folder?
Not always, but a sudden drop at one provider is a strong hint. Check whether your SPF, DKIM and DMARC records pass, whether your spam rate stays below 0.3% (ideally below 0.1%), and whether one-click unsubscribe is working. Gmail and Yahoo have required all three from bulk senders since 2024.
Sources
- Google Workspace Admin Help: Email sender guidelines and Email sender guidelines FAQ
- Yahoo Sender Hub: Sender best practices and FAQs
- Microsoft Tech Community, Outlook blog: Strengthening Email Ecosystem, Outlook’s New Requirements for High-Volume Senders (April 2, 2025)
- Apple Support: Use Mail Privacy Protection on iPhone, and “Unable to load remote content privately”
- IETF RFC 8058: Signaling One-Click Functionality for List Email Headers
- Federal Trade Commission: CAN-SPAM Act, A Compliance Guide for Business