
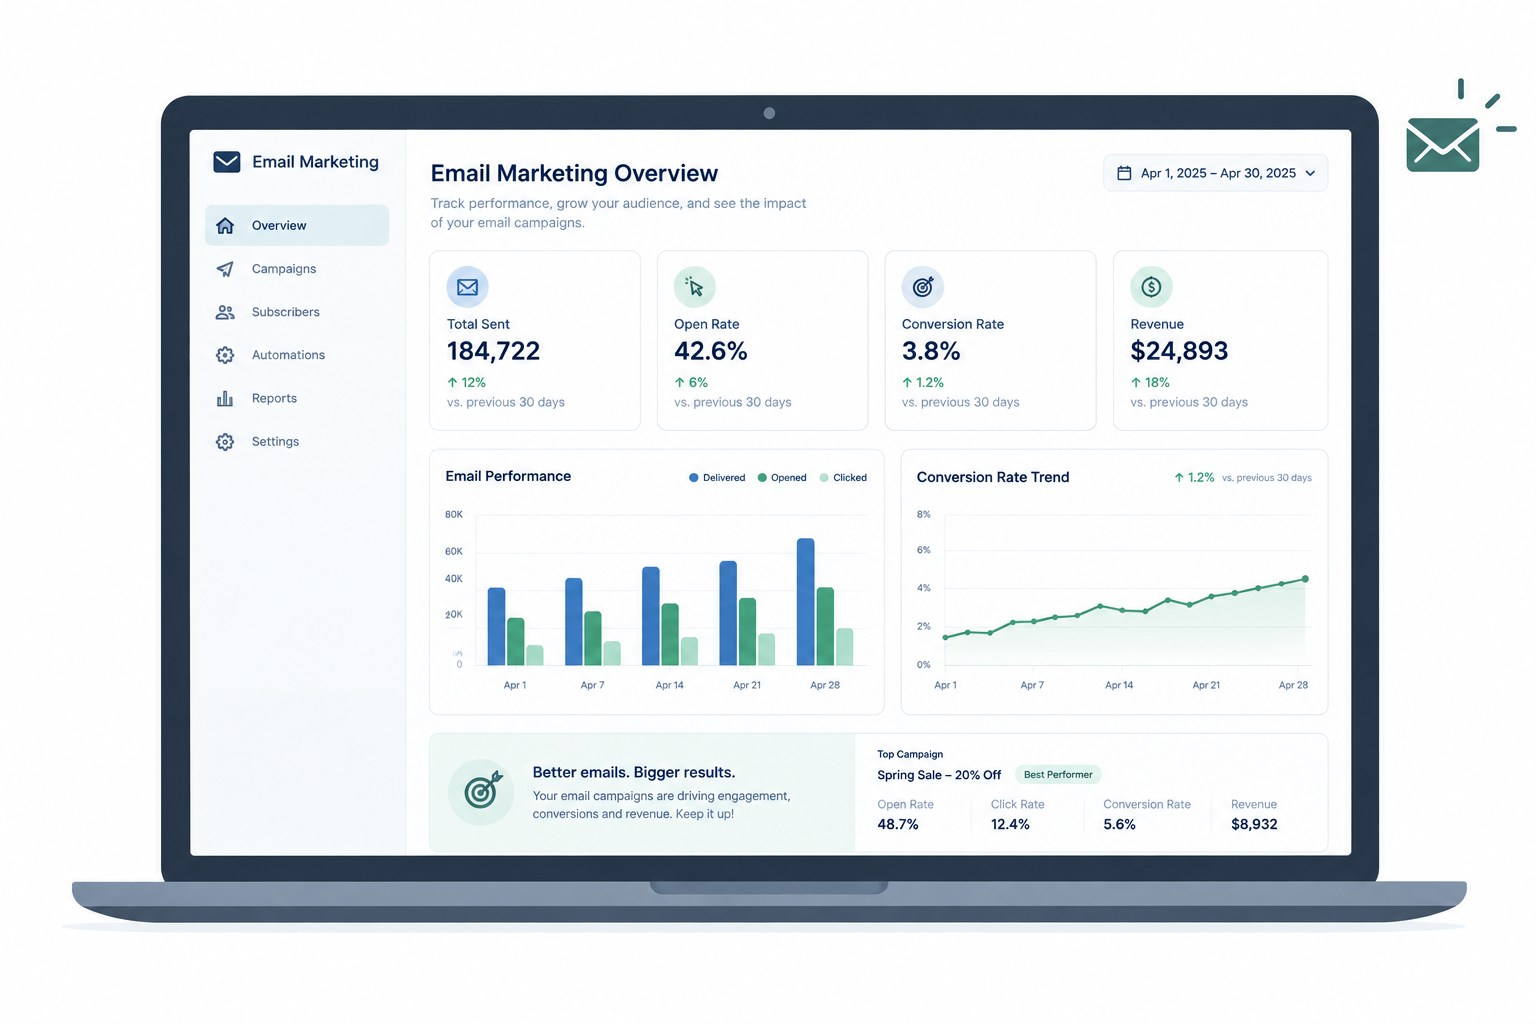
To measure email success in November 2026, look past open rates. Track click-to-open rate, conversions from clicks, leads, revenue and orders per email delivered, and your spam complaint and unsubscribe rates. Two things have changed since this post was written. Apple Mail Privacy Protection now preloads tracking pixels, which makes open rates look higher than they really are. And since 2024, Gmail, Yahoo and later Microsoft require bulk senders to authenticate with SPF, DKIM and DMARC, offer one-click unsubscribe and keep spam complaints low, so complaint rates now matter as much as revenue does.
An earlier post on this blog argued that the open rate may not be the best number to focus on. So what should you track to judge how your email marketing is doing overall? The MarketingSherpa 2007 Email Benchmark Guide offered some suggestions. They still hold up, with a few corrections and additions for how email works today.
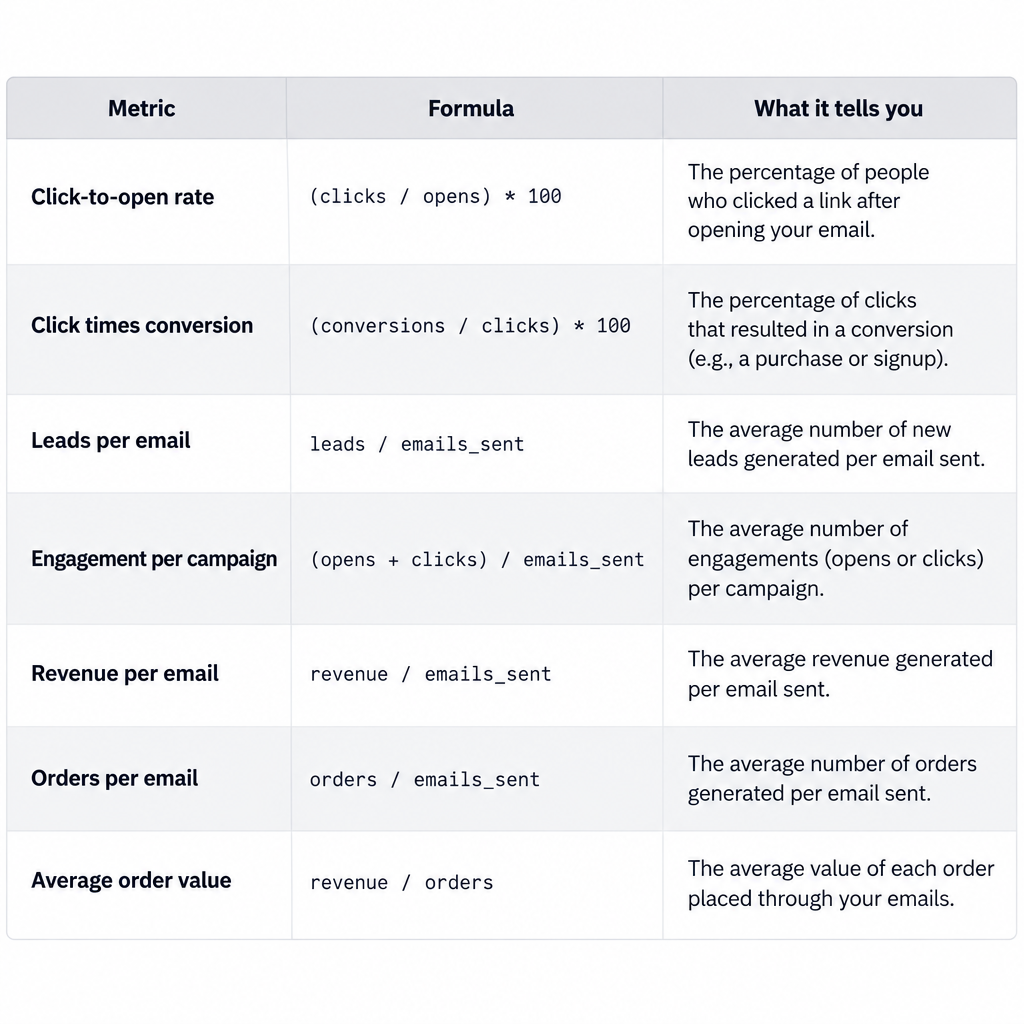
The table below gives each metric with its formula. The sections after it explain them one by one.
| Metric | Formula | What it tells you |
|---|---|---|
| Click-to-open rate (CTOR) | Unique clicks ÷ unique opens | How well the content worked for people who opened it |
| Click times conversion | Clicks × conversion rate | How many people acted after they clicked |
| Leads per email | Leads ÷ emails delivered | Which offers and lists bring in leads |
| Engagement per campaign | Count of non-purchase actions | Interest in your brand that isn’t about money |
| Revenue per email | Email revenue ÷ emails delivered | What each message earned |
| Orders per email | Orders ÷ emails delivered | Which messages drove purchases |
| Average order value | Email revenue ÷ orders | How big each email-driven order was |
Click-to-open rate
Click-to-open rate is your unique clicks divided by your unique opens. You get the same result by dividing the click rate by the open rate. Because the formula only counts opened messages, it shows which content people found worth clicking once they had opened the email.
There is one catch today. Apple Mail Privacy Protection, launched in 2021, fetches images, tracking pixels included, through Apple’s servers. That means a message can be recorded as opened even if nobody read it. Inflated opens make the bottom of the fraction bigger, so the CTOR you see is lower than the real figure. For comparison, MailerLite’s benchmark data put the average CTOR at 6.81% for 2025 campaigns, up from 5.63% in 2024. Compare your own CTOR against your own past campaigns first, because the share of Apple Mail users in your list shifts this number more than anything else.
Click times conversion
This metric is click-throughs multiplied by the conversion rate. The result is simply the number of people who clicked and then did what you wanted, such as buying, signing up or booking. Since opens are left out, you see how the campaign performed with people who actually clicked. That has made this metric more useful over time, because a click still needs a real person while an open no longer does.
To track it, tag your links with UTM parameters so your analytics tool can connect the visit to the email. If 400 people click and 5% of them convert, the campaign produced 20 conversions. Two campaigns with the same click count can have very different conversion counts if one sends people to a weak landing page.
Leads per email
If your focus is lead generation, this metric lets you compare offers and lists simply. Take the number of leads you received and divide it by the number of emails delivered. For example, 30 leads from 10,000 delivered emails gives 0.3%, or 3 leads per 1,000 emails.
Count referrals too. Ask how many forward-to-a-friend or refer-a-friend messages turned into new opt-ins. Every referred subscriber should still confirm their own sign-up. Adding addresses that someone else typed in, without that person’s consent, will bring spam complaints.
Engagement per campaign
This measures the impact of your message that isn’t about money. How many subscribers took part in something? Count contest entries, profile or preference updates, survey answers and replies to the email. The original guide also listed comments on a message board. Most brands now see that kind of activity in social comments or community forums.
Getting subscribers involved keeps your brand in front of them. It also helps with deliverability. Mailbox providers watch how recipients interact with your mail, and replies and preference updates are much better signals than silence or a spam report.
Metrics for retail and ecommerce emails
If your messages are about retail or ecommerce, review a few more metrics. Most ecommerce platforms, such as Shopify, and most ESPs, such as Klaviyo and Mailchimp, report these once store tracking is turned on.
Revenue per email
Divide the total revenue your email campaign generated by the number of emails delivered. The original guide divided by emails sent. Using delivered emails is now more common, because bounced messages never had a chance to earn anything. Comparing the revenue tied to each campaign shows which messages and offers bring in the most money.
This metric also shows what poor deliverability costs you. If 10% of a list stops reaching the inbox, revenue per email falls even when the offer is just as strong. Keep in mind that revenue is credited to email using your platform’s attribution window, often a few days after a click or open. Check that window before you compare numbers from two different tools.
Orders per email and average order value
Older versions of this list called this metric “order size per email,” but the formula was the total number of orders divided by the number of emails delivered. That is orders per email. It’s a very good way to compare messages: did one element in a message lead to more orders?
Order size is a separate number. Average order value is email revenue divided by the number of orders. Track both. One campaign might bring in many small orders while another brings in fewer, larger ones. Average order value also lets you segment future campaigns by order size, for example sending upsell offers to customers who usually place large orders.
Deliverability and list health metrics
These metrics weren’t on the 2007 list, but today they decide whether your other numbers mean anything. Since February 2024, Gmail and Yahoo have required bulk senders to authenticate with SPF, DKIM and DMARC, support one-click unsubscribe, and keep user-reported spam rates below 0.3%. Gmail’s own help pages ask senders to stay under 0.1% in Google Postmaster Tools. Gmail stepped up enforcement in November 2025. Microsoft added similar rules for senders of more than 5,000 messages a day to Outlook.com, Hotmail.com and Live.com addresses, starting May 5, 2025.
Watch these four numbers on every campaign:
- Spam complaint rate: complaints divided by delivered emails. Check it in Google Postmaster Tools and in your ESP’s reports.
- Bounce rate: hard bounces should be removed from your list right away.
- Unsubscribe rate: a sudden rise usually means a frequency or targeting problem. Gmail and Yahoo expect one-click unsubscribe requests to be processed within two days.
- Delivery rate: delivered divided by sent. It’s the base for every per-email metric above.
Putting the numbers to work
An email campaign tells you much more than its open rate. Choose one main metric that matches the campaign’s goal: revenue per email for a sale, leads per email for a webinar invite, CTOR for a content newsletter. Then use spam rate and unsubscribes as guardrails. If a campaign wins on revenue but doubles your complaints, it hasn’t really won.
Tracking these metrics helps you understand how your subscribers behave. You can use what you learn to send more relevant messages next time, and relevant messages are what keep you in the inbox.
FAQ
Are open rates still worth tracking at all?
Yes, but only as a rough trend and a deliverability warning sign, not as a measure of success. A sharp drop in opens on Gmail or Yahoo addresses can point to a spam-folder problem. Since Apple Mail Privacy Protection inflates opens, avoid using open rate to pick the winner of A/B tests or to decide who counts as an engaged subscriber.
What is a good click-to-open rate?
MailerLite’s benchmark data put the average at 6.81% for 2025 campaigns. Other reports use different methods and give different figures. Your own trend over time is a better guide than any industry average, because the share of Apple Mail users in your list strongly affects your measured CTOR.
Should I divide by emails sent or emails delivered?
Use emails delivered for leads, revenue and orders per email, since bounced messages never reached anyone. Track delivery rate separately so a bounce problem shows up on its own. Whichever you choose, use the same base every time so campaigns can be compared fairly.
What spam complaint rate gets me into trouble with Gmail and Yahoo?
Yahoo says to keep complaint rates below 0.3%. Gmail says senders should keep their spam rate below 0.1% and avoid ever reaching 0.3% or higher. Gmail also says senders whose spam rate is above 0.3% can’t get mitigation help until it comes down.
Which metric should I report to my boss or client?
Report the one closest to money or the business goal: revenue per email for ecommerce, leads per email for B2B, conversions for sign-ups. Add spam complaint rate and unsubscribe rate as health checks, so a short-term revenue spike doesn’t hide damage to your sender reputation.
Do these metrics change anything under CAN-SPAM?
Metrics don’t, but how you grow and mail your list does. CAN-SPAM requires a working opt-out, honoured within 10 business days, plus a valid physical postal address and honest header and subject information. The maximum civil penalty is $53,088 per violating email. That is the 2025 level, which stayed in place after the FTC announced no adjustment for 2026.
Sources
- Google Workspace Admin Help: Email sender guidelines
- Gmail Help: Top 10 Gmail sender issues
- Yahoo Sender Hub: Sender best practices
- Microsoft Tech Community: Outlook’s new requirements for high-volume senders
- FTC: CAN-SPAM Act, a compliance guide for business
- Federal Register: FTC civil penalty notice, September 15, 2026
- MailerLite: Email marketing benchmarks